Data Visualizations
Many State entities utilize maps as a tool to communicate with their audience. The Agency of Digital Services has approved the use of Datawrapper. This tool allows users to generate accessible maps, charts, and tables that can be embedded into State of Vermont websites. These are embedded in the 'Body' field of a 'Basic Page' editing window. When a Datawrapper graphic is embedded into a webpage, it is automatically updated each time it is edited in Datawrapper. This streamlines the editing and update process because users only need to make edits to the graphic in Datawrapper. All instances where the graphic has been placed will then automatically be updated. Below are examples of a map, chart, and table generated with Datawrapper. Visit the Datawrapper site to learn more about how to use this tool. Follow the steps below to embed a map, chart, or table that you create into your website.
Please Note: You must be logged in to the State of Vermont website that you are editing to follow the instructions below.
Embed a Datawrapper Visualization
Embed a Datawrapper Visualization
Please Note: To embed a Datawrapper item, you must be in the editing window for a basic page.
- Publish & Embed
In Datawrapper, 'Publish & Embed' the map, chart, or table.
- Share & Embed
In Datawrapper, under the 'Share & Embed' details under the 'Publish & Embed', copy the 'Embed Code for your visualization'. Be sure to leave 'Responsive iframe' selected.
- Content
On your State of Vermont website, select 'Content' on the top navigation.
- Title
Enter the page 'Title' in the search field to locate the page you would like to place the map, chart, or table.
- Edit
Once the page you would like to edit appears in the list, select 'Edit' on the right side of the listing.
- Source
Select the 'Source' button in the tools menu.
- Paste
Scroll to the end of the 'Source' code of your webpage. Place your cursor at the end of the content and add a couple of returns. Paste the 'Embed Code for your visualization'.
- Save
Select 'Save'.
- View
View the page to confirm that the Datawrapper map, chart, or table appears as intended.
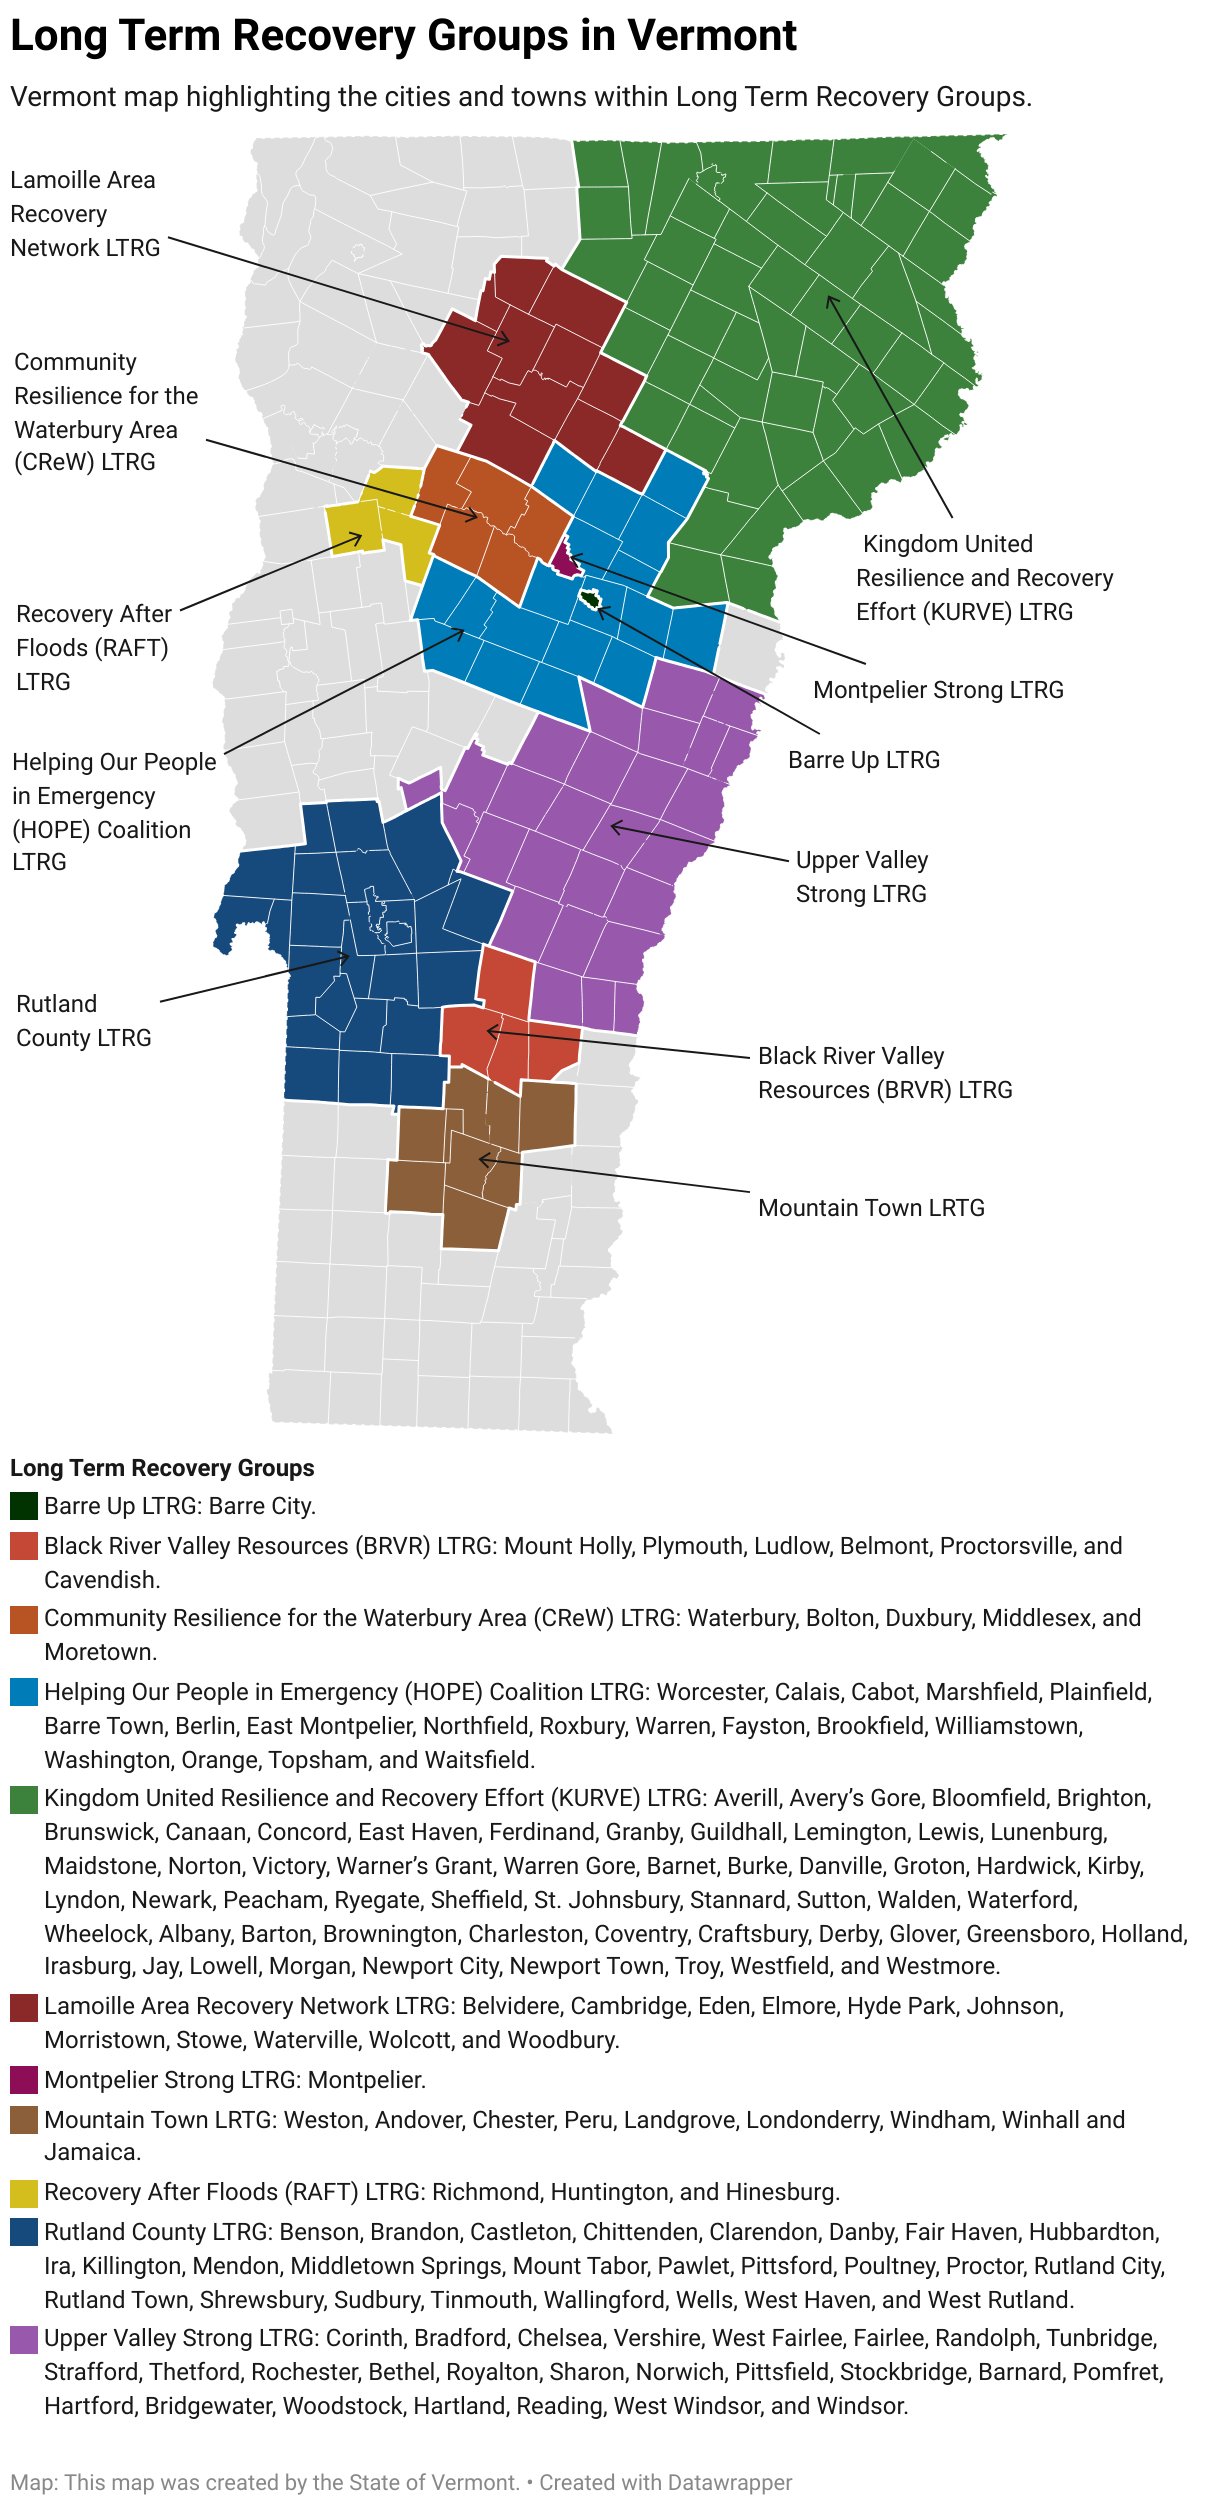
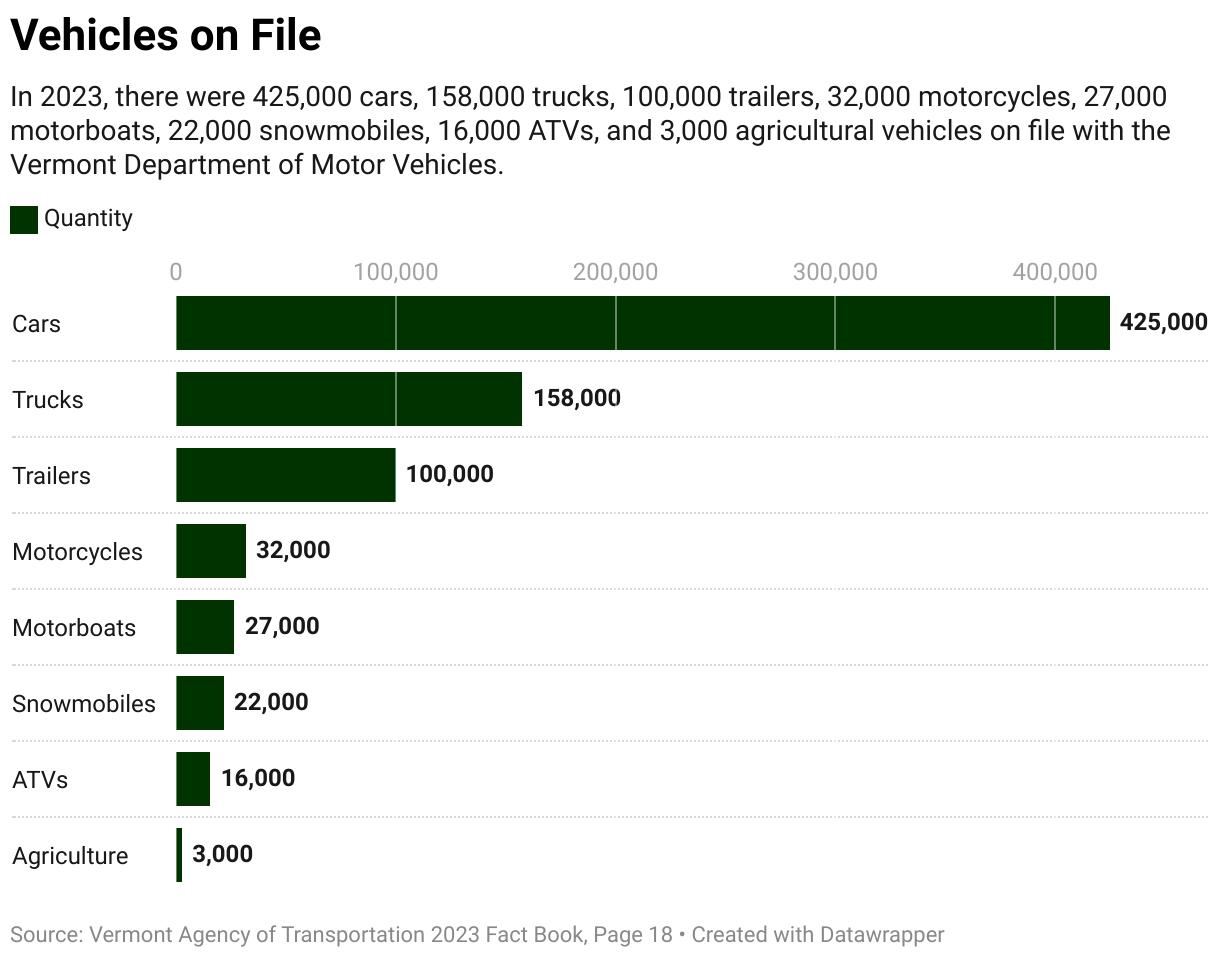
Example Data Visualizations
Below are examples of Datawrapper Visualizations.